Visualization
How to visualize the representations using t-SNE?
Many algorithms aim at aligning feature representations between source and target domain.
Through visualization, you can find and analysis the mis-alignment between different domains.
After training DANN, in directory examples/domain_adaptation/image_classification, run the following command
CUDA_VISIBLE_DEVICES=0 python dann.py data/office31 -d Office31 -s A -t W -a resnet50 --epochs 20 --seed 1 --log logs/dann/Office31_A2W --phase analysis
It may take a while, then in directory logs/dann/Office31_A2W/visualize, you can find
TSNE.png.
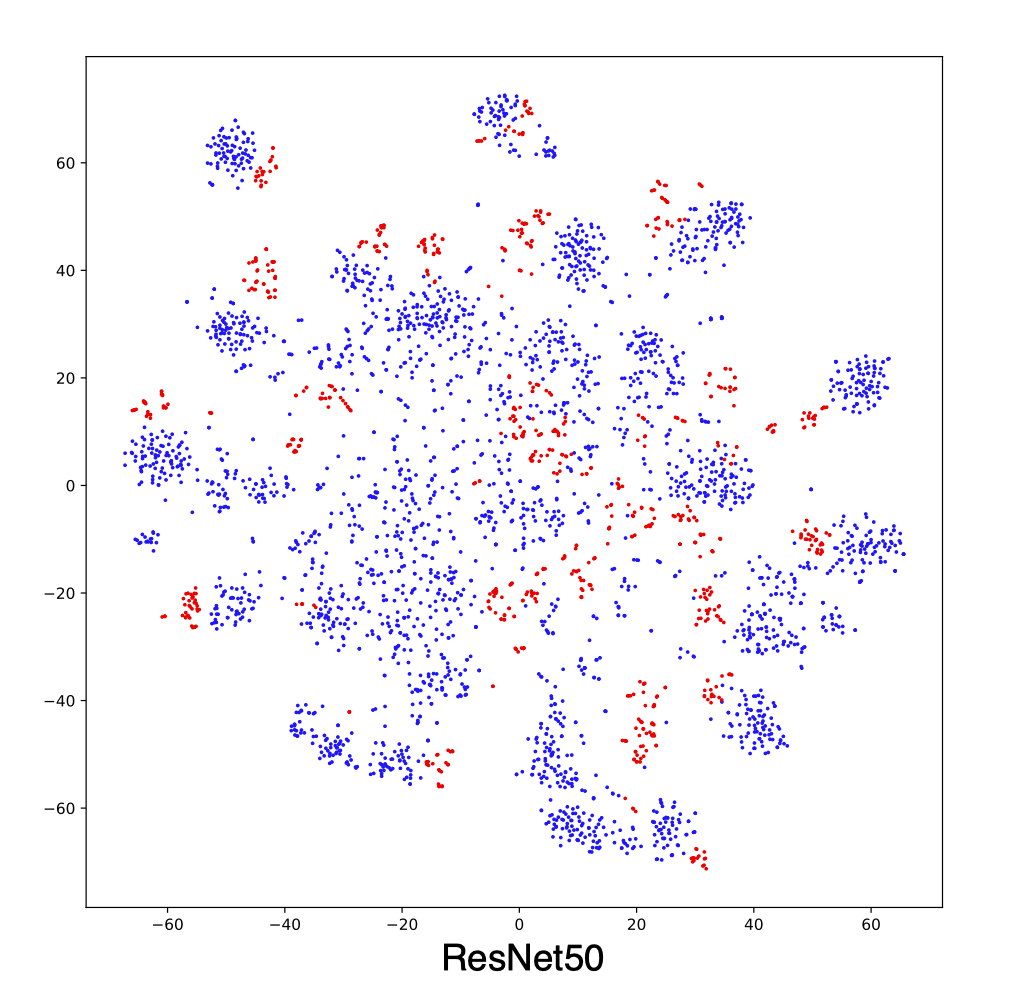
t-SNE of representations from ResNet50 trained on source domain.
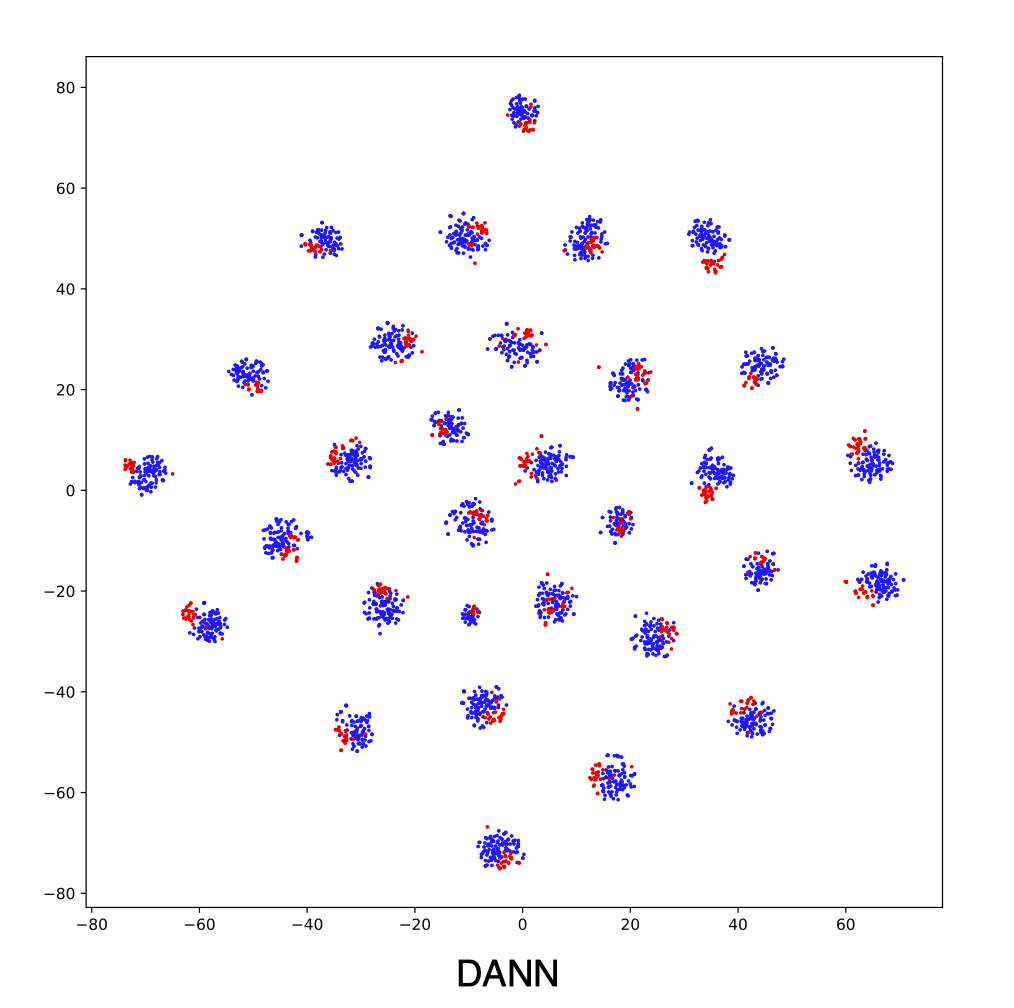
t-SNE of representations from DANN.
How to visualize the segmentation predictions?
For each segmentation algorithms, we’ve implemented the visualization code. All you need to do is set --debug during training.
For instance, in the directory examples/domain_adaptation/semantic_segmentation,
CUDA_VISIBLE_DEVICES=0 python source_only.py data/GTA5 data/Cityscapes -s GTA5 -t Cityscapes --log logs/src_only/gtav2cityscapes --debug
Then you can find visualization images in directory logs/src_only/gtav2cityscapes/visualize/.
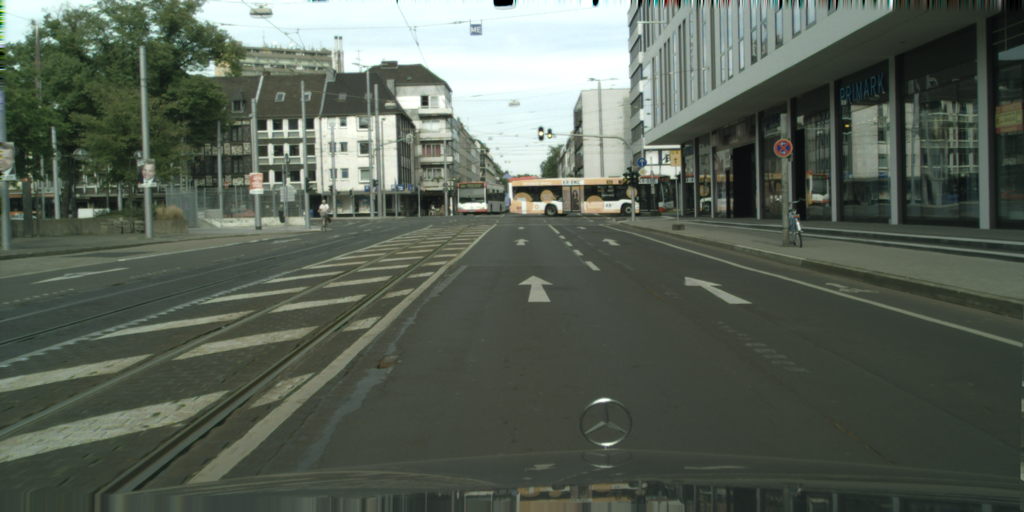
Cityscapes image.
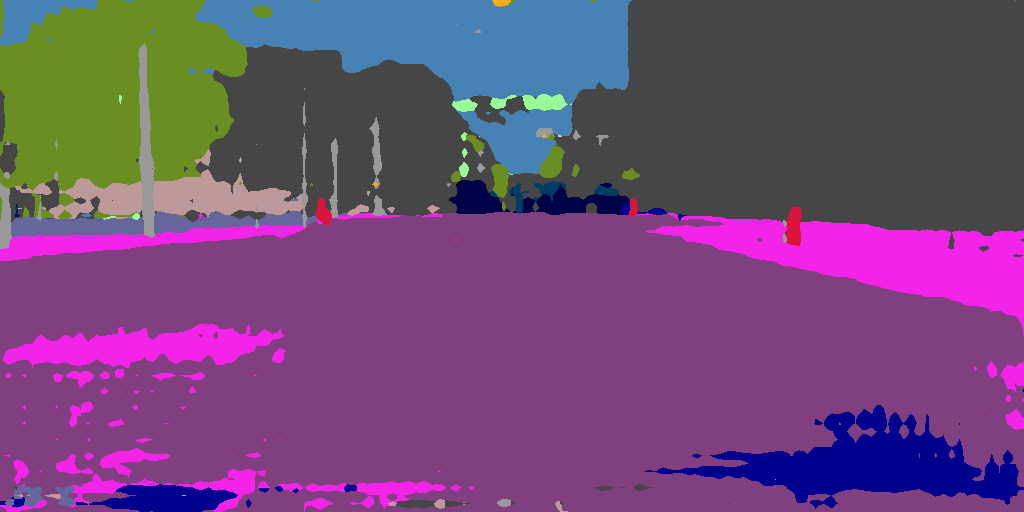
Segmentation predictions.
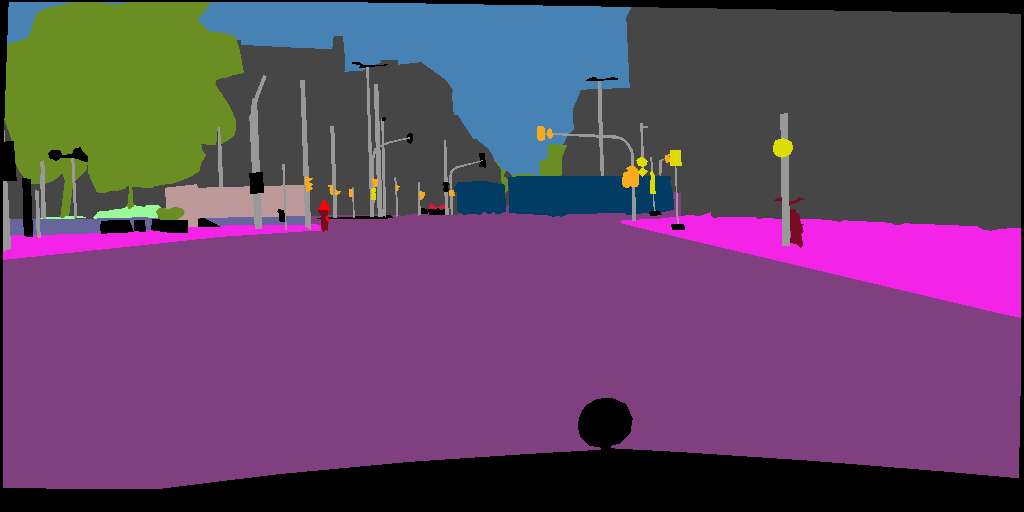
Segmentation labels.
Translation model such as CycleGAN will save images by default. Here is the translation results from source style to target style.
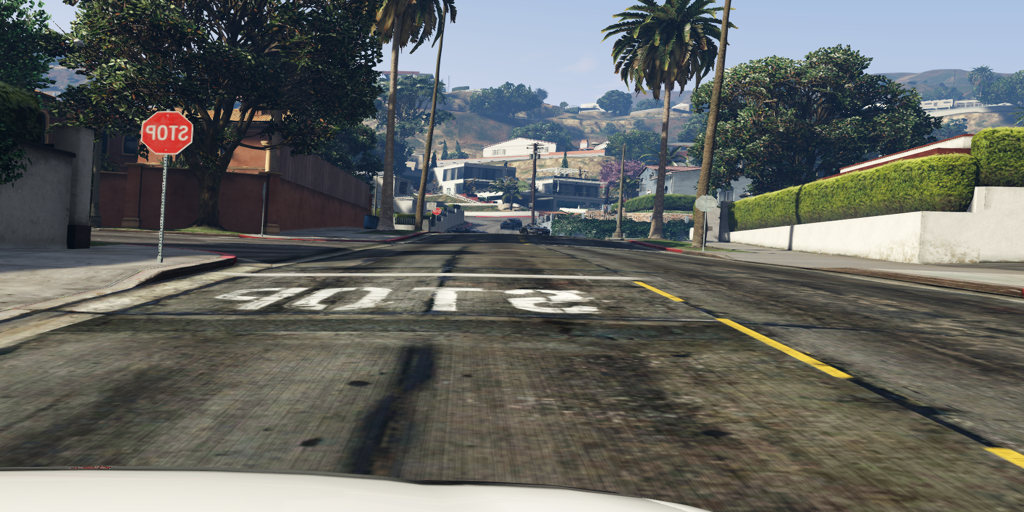
Source images.
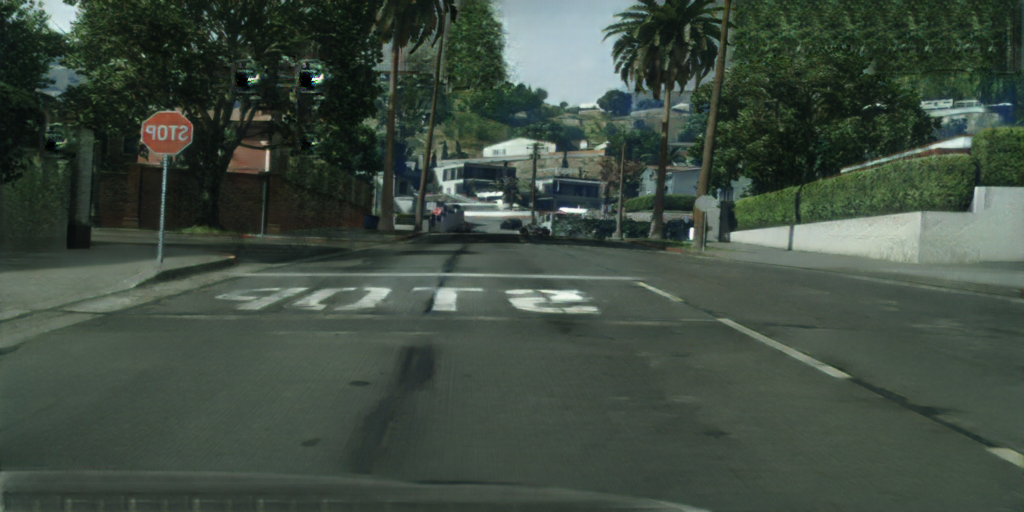
Source image in target style.
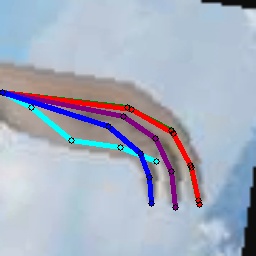
How to visualize the keypoint detection predictions?
For each keypoint detection algorithms, we’ve implemented the visualization code. All you need to do is set --debug during training.
For instance, in the directory examples/domain_adaptation/keypoint_detection,
CUDA_VISIBLE_DEVICES=0 python source_only.py data/RHD data/H3D_crop -s RenderedHandPose -t Hand3DStudio --log logs/baseline/rhd2h3d --debug --seed 0
Then you can find visualization images in directory logs/baseline/rhd2h3d/visualize/.